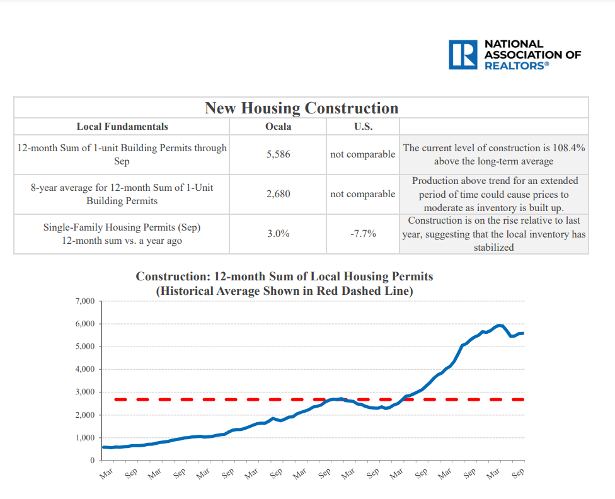
A chart titled “New Housing Construction” by the National Association of Realtors shows data and trends for local housing permits compared to the U.S. The graph at the bottom displays the 12-month sum of Ocala real estate investment permits, with a historical average marked by a red dashed line.